Session Statistics
Average, median, mode, and standard deviation calculated instantly for every story.
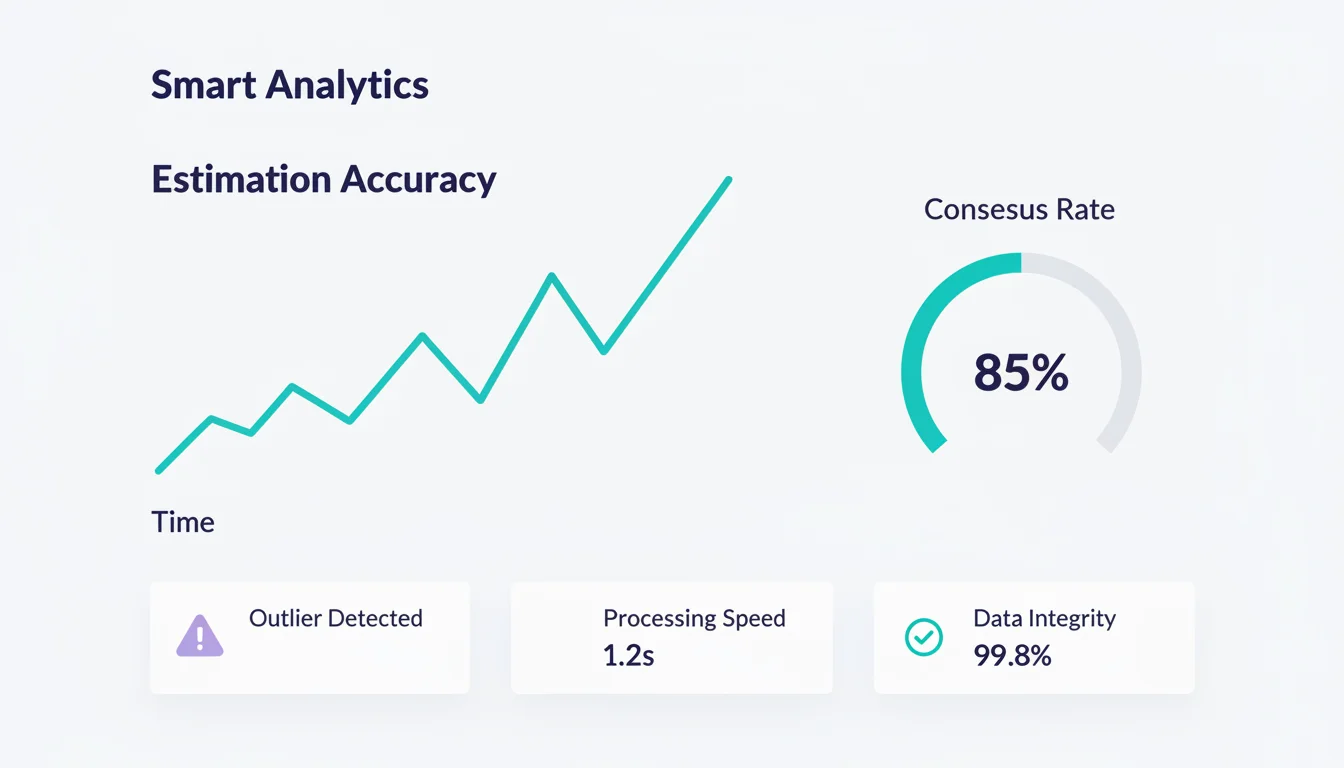
See the numbers behind your estimates
Each session shows average, median, mode, and standard deviation. Session history lets you review past estimates and see how your team's accuracy changes over time. Outlier votes are highlighted so you know what to discuss.

Average, median, mode, and standard deviation calculated instantly for every story.
Review past estimation sessions to track trends and improve accuracy over time.
Quickly identify votes that diverge significantly to facilitate targeted discussion.
Measure how often your team agrees and watch consensus rates improve sprint over sprint.
Run your planning poker sessions normally. Data is captured automatically.
After each session, see detailed statistics including averages, spread, and consensus.
Access session history to see how estimation patterns and accuracy evolve across sprints.
Free plan, no credit card. Create a team and start estimating in about a minute.
Start Estimating Free